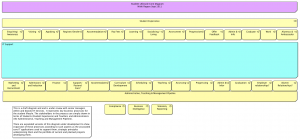
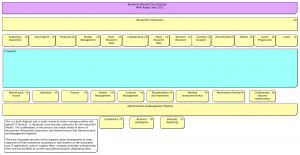
Inspired by some work the ITANA group have been doing in the USA (https://spaces.internet2.edu/display/itana/Lifecycle+Management+and+Analysis) I’ve been developing two main lifecycle diagrams here at the University of Bristol. These are proving invaluable in discussions with a very wide range of stakeholders across the institution – both within and outside of IT Services.
We are developing our understanding of both the Research and Student lifecycles currently, and with each we are considering the administrative/management “pipeline” that runs in parallel to those lifecycles – on the same diagram (see below). As regards the latter, these are processes in support of the key activities typically undertaken as part of the “cradle to grave” continuum for students and researchers. It is proving very useful to consider both the relationship and the difference between these two perspectives – otherwise it is all too easy to neglect to consider what the Student, say, is experiencing in relation to the IT systems they need to interact with at the University, and instead to become preoccupied with creating administrative efficiencies and ensuring that we manipulate Student data according to our own reporting, management and business intelligence agendas.
Things get interesting once we start to fill out different versions of these lifecycle diagrams, showing information in the central blue area of the diagram. For example, in our Enterprise Continuum we hold diagrams that show all the systems that are interacted with along the lifecycles, colour coded according to diversity or uniformity of use across the institution. This depiction has sparked striking reactions from a range of personnel with comments such as “I never realised that students interact with so many systems”, “Why haven’t we had diagrams like this before now?” and “Can we use the systems view to analyse what impact an increase of student numbers would have on the performance of our systems?”.
Things we want to do next include showing the unit costs of systems as best we can, showing the business value that systems contribute and projects currently running that target parts of the student or researcher lifecycles. From this we hope to get a clearer, holistic picture of whether we are making investments in a truly strategic way and if not how we would get closer to that situation.

